If you want to gain a thorough understanding of your business performance, you need to be able to ask the right questions of your data. But to produce insightful analytics in a changing business landscape, you need a tool with the flexibility to answer those questions quickly and accurately. There are many business intelligence tools around right now, but none has grown in popularity as quickly as Microsoft’s Power BI platform.
What is Power BI?
According to Microsoft, “Power BI a unified, scalable platform for self-service and enterprise business intelligence (BI). Connect to and visualize any data, and seamlessly infuse the visuals into the apps you use every day.”
Power BI is a tool we’ve used as part of our data analytics consulting services for quite some time. Our clients have seen how effectively this tool has transformed their reporting, and we believe Power BI can transform your reporting, too.
Below we’ve outlined 6 facts you should know about Power BI. Our goal is to explain the key features you should know about and, hopefully, spark your creativity about how you can put it to work.
Key Features of Microsoft’s Power BI Platform
1. Power BI streamlines traditional BI development
The traditional model for getting a report requires putting a request into your IT team. Typically this process is slow, since building an ad-hoc report from scratch can be tedious–plus, IT teams are normally very busy!
Another option would be to find someone on your team with decent enough Excel skills to stitch together the data, transform the results, if necessary, create the proper tables or charts, and tie it all together in one coherent report. The problem is, Excel reports aren’t easily reproducible, and often rely on the expertise of the person building them to keep them up-to-date.
As you can see, neither option is ideal.
Fortunately, Power BI streamlines this process. By providing an all-in-one business intelligence solution with a user-friendly interface, non-technical people can perform the kinds of analytics that were previously reserved for technical specialists.
In Power BI, it’s easy to connect to a variety of data sources, such as Excel, Facebook, active directory, Odata feeds, and others. From there, you can quickly summarize findings into a simple report, no programming required! And for those willing to learn the more technical side, Microsoft’s DAX query language allows for a greater degree of analytical depth and precision.
2. Power BI Builds on the Familiar Experience of Excel
Many of our clients have resigned themselves to believing that, as part of the cost of doing business, someone needs to spend a lot of time pulling data out of various databases and shaping it into a format that allows leaders and department members to understand performance of the business.
This is no longer the case. Any Excel user comfortable with building models and using advanced functions like XLOOKUP will be able to easily make the change to Power BI. Not only are the user interfaces and formulas similar, you can also utilize many of the add-on tools you’ve already encountered in Excel.
For example, with Power BI’s Power Query tool, you can easily connect to your data sources and shape your data, saving time and reducing errors. You can also filter, sort, and modify the format and layout of data. This comes in handy when you want to do something like connecting to a data source containing 10 years of data but you’re only interested in the last month’s worth of information. You can even share these data queries with other users to use them in other workbooks.
If you’re interested in Power Query, you can learn more in Chris Webb’s book, Power Query for Power BI and Excel.
Additional add-ons like Power Pivot and Power View are also available to save your business time and resources. Using Power Pivot, you can generate tabled reports on large data sets and then render visualizations in Power View, all from the same place where you are working with traditional Excel data.
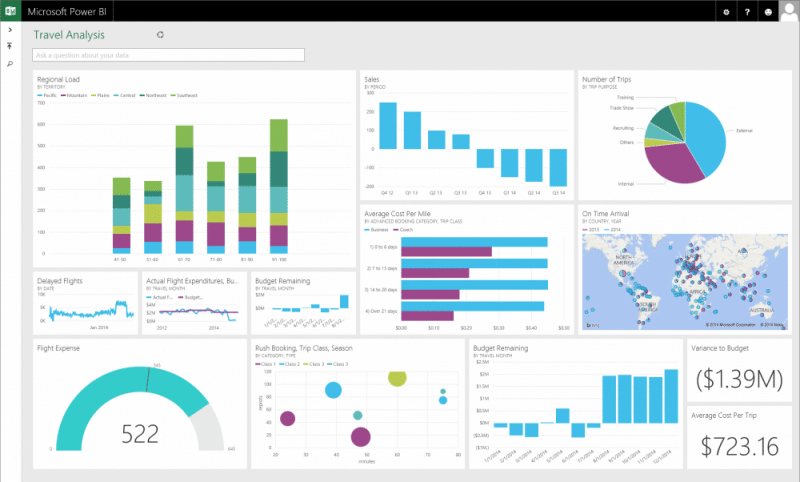
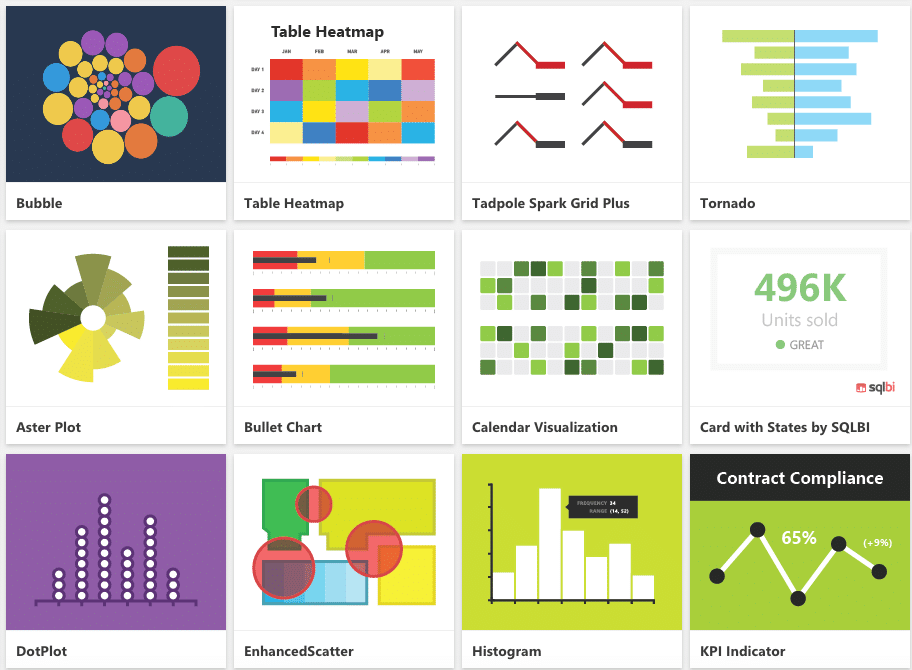
3. Power BI offers a full library of customizable visualization features
Out of the box, Power BI comes with many attractive visualization options. And since Microsoft introduced open-source visualization development, even more visualizations are available as community-created content. You can access a library of custom visualizations, or build your own. Here are several examples that can be downloaded and used with your own data:
4. Power BI is extremely cost effective
Power BI is perhaps Microsoft’s most promising innovation in years. It can revolutionize how your company uses data, reducing the need for prolonged data development projects. It gives businesses an alternative to the expensive licensing schemes of the older business intelligence technologies of years ago.
The “engine” of Power BI – Power Pivot, Power Query, and Power View – is built into Excel 2016 and later. The Desktop application is free. PowerBI.com is also free for up to 1GB of data per month, with more data priced at $10/month/user. This is a very effective cost basis!
5. Power BI can effectively replace your enterprise applications’ reporting
We work with many clients who have ERP and other systems in place. A common scenario we see is that our client seeks to get the vendor to add “built-in” reports in the application, because “out-of-the-box” functionality doesn’t suit their needs. Unfortunately, their desires are often frustrated by the inability of the software vendor to customize in a timely fashion. As long as the vendor can provide a connection to the data source, Power BI can give your company the ability to report on anything.
Here’s how Microsoft describes the flow of data, from aggregating to developing and publishing:
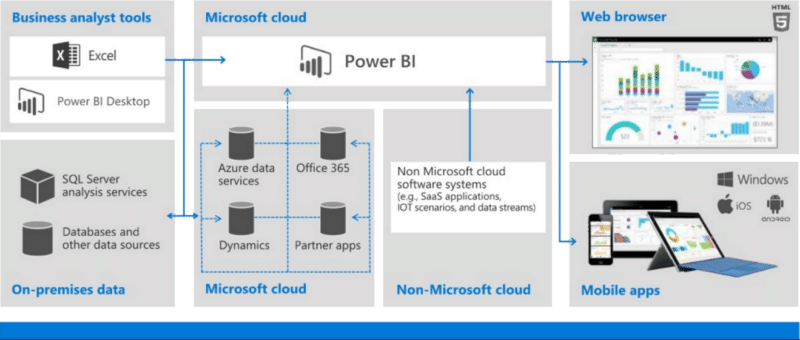
If you are technically inclined or love details, you will enjoy this blog post which shows a comprehensive analysis of how data flows in an ecosystem that includes Power BI.
6. Sharing in Power BI is super simple
A major pain point many of our clients face is the inability to easily share reports. Traditionally, sharing reporting has either been limited by the cumbersome nature of emailing Excel reports, or, when business intelligence software is involved, paying for expensive software licensing.
Fortunately, with Power BI users can share their reporting on the web via PowerBI.com. Live reports can even be embedded into your company’s web page, allowing for additional convenience.
How to Get Started Using Power BI
You can download Microsoft’s free Power BI program, Power BI Desktop, and build summary reports and visualizations there. This tool is ideal if you are emphasizing visualizations and especially if you want to share reports.
If your business is struggling to integrate data and create meaningful reports, why not give Power BI a try? You might find that it takes your business intelligence efforts to an entirely new level.
If you have any follow-up questions, feel free to get in touch with our data science team.